Dashboard
Location: Sidebar → Dashboard
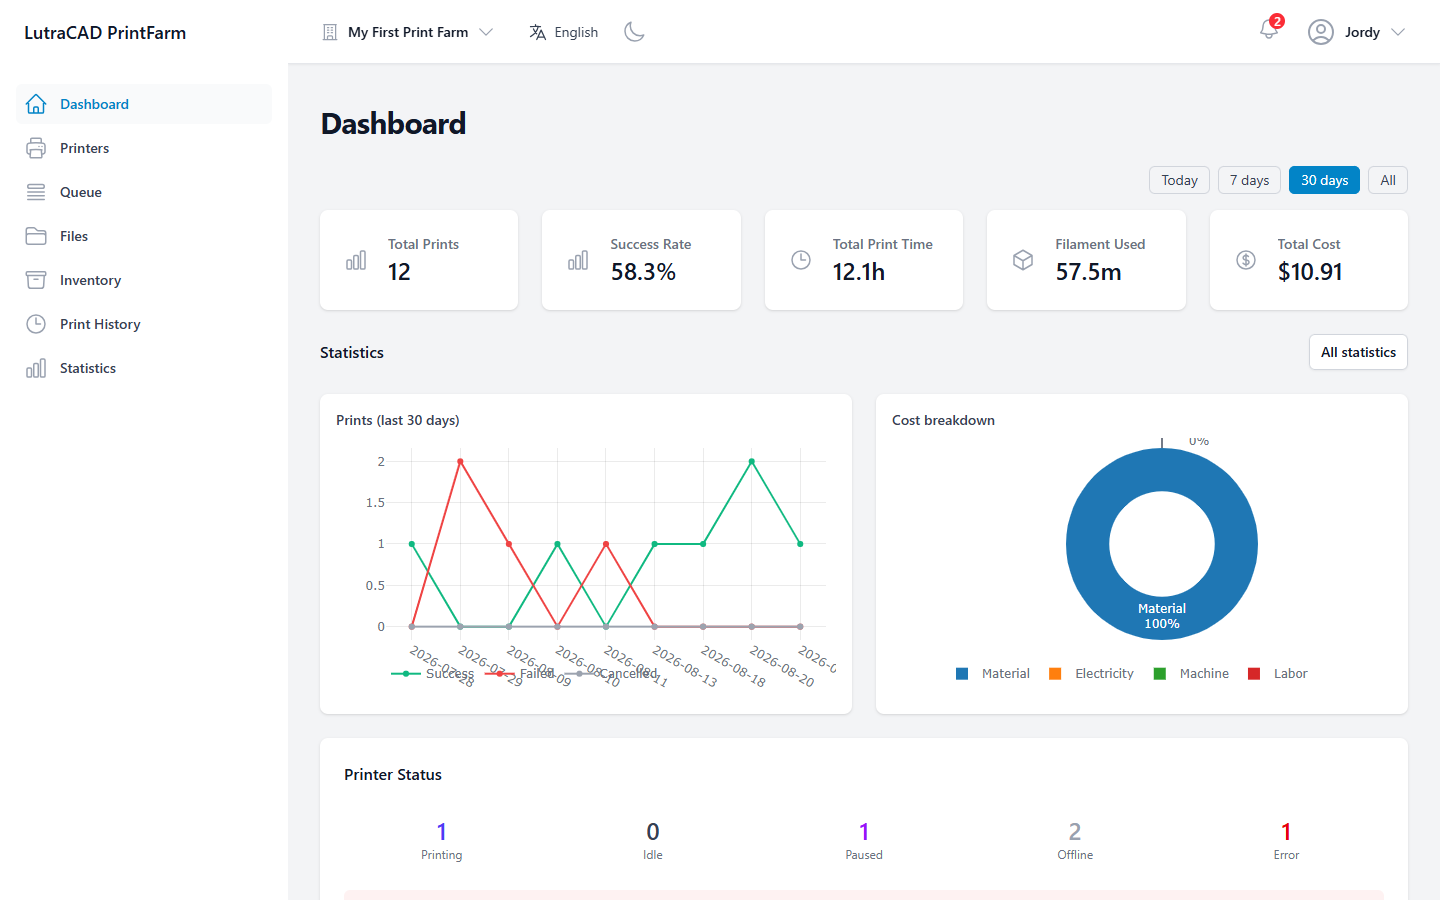
The Dashboard is your landing screen. It has three parts: a row of key figures, an optional statistics block, and the printer status overview. The whole screen updates live: as printers change state, the counts and tiles move without a page refresh.
The KPI row
A period toggle at the top right, Today, 7 days, 30 days (the default) and All, drives five cards:
| Card | Shows |
|---|---|
| Total Prints | Number of prints in the period |
| Success Rate | Successful prints as a percentage |
| Total Print Time | Total hours printed |
| Filament Used | Metres of filament used |
| Total Cost | Total cost in the farm's currency |
The statistics block
A Statistics section appears only if your plan includes statistics. When shown, it has:
- An All statistics link to the full Statistics screen.
- A Prints (last 30 days) line chart, split into Success, Failed and Cancelled.
- A Cost breakdown donut, split into Material, Electricity, Machine and Labor.
Printer status
Printer Status sorts every printer in the farm into five tiles: Printing, Idle, Paused, Offline and Error. Each tile is a shortcut to the Printers list filtered by that status.
Below the tiles:
- Soonest finishing names the print that will finish first, with its remaining time. It appears only while something is printing.
- Printers needing attention is a red panel listing any printer in an error state, each with a View link. It appears only when a printer has an error.