Statistics
Location: Sidebar → Statistics
Statistics is a set of charts and tables for the farm. It is a plan feature: farms without it see an upgrade panel, and with no farm selected the page shows No farm selected.
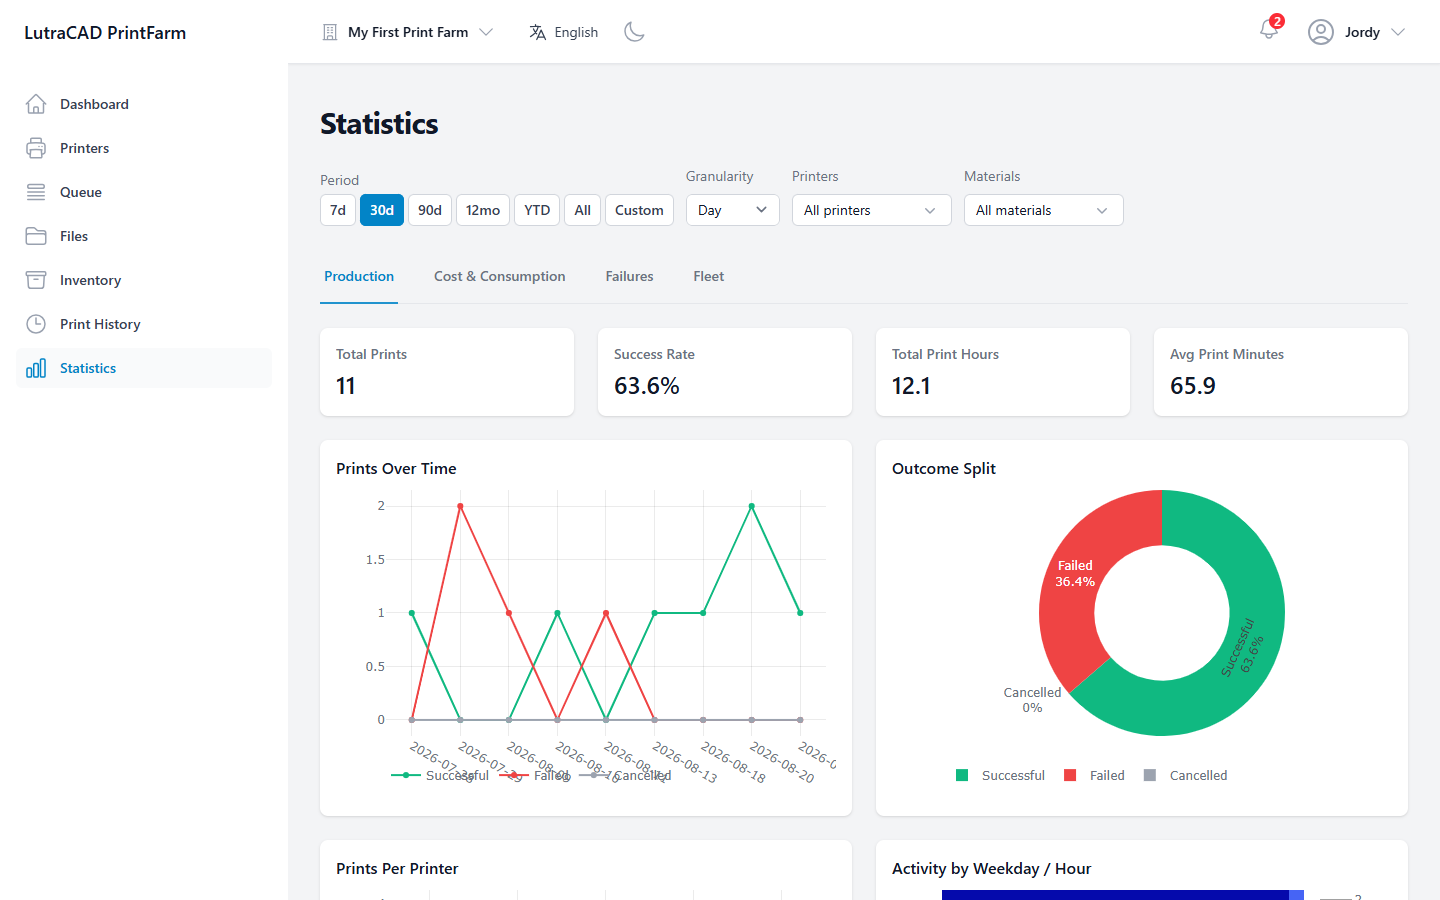
The filter bar
A shared filter bar sits above four tabs. You choose:
- A Period: 7d, 30d, 90d, 12mo, YTD, All or Custom with From and To dates.
- A Granularity: Day, Week or Month.
- Optionally, specific Printers and Materials to narrow to.
The tabs
| Tab | Shows |
|---|---|
| Production | Total Prints, Success Rate, Total Print Hours and Avg Print Minutes, plus charts for prints over time, the outcome split, prints per printer, and an activity heatmap by weekday and hour. |
| Cost & Consumption | Total Cost, Cost / Print, Filament (kg) and Energy (kWh), with cost, filament and energy broken down over time, per printer and per material. |
| Failures | Failure Rate, Failed Prints, Wasted Filament and Wasted Cost, with failures by reason, over time and per printer. |
| Fleet | A per-printer table (prints, hours, cost, success %, filament, utilisation, maintenance) and a utilisation chart. |